Skip to content
New issue

Have a question about this project? Sign up for a free GitHub account to open an issue and contact its maintainers and the community.

By clicking “Sign up for GitHub”, you agree to our terms of service and privacy statement. We’ll occasionally send you account related emails.

Already on GitHub? Sign in to your account

基于canvas使用贝塞尔曲线平滑拟合折线段 #31

Open
Aaaaaaaty opened this issue Dec 10, 2017 · 9 comments
Open

基于canvas使用贝塞尔曲线平滑拟合折线段 #31

Aaaaaaaty opened this issue Dec 10, 2017 · 9 comments
Labels

Comments

@Aaaaaaaty
Copy link
Owner

写在最前

本次分享一下在canvas中将绘制出来的折线段的棱角“磨平”,也就是通过贝塞尔曲线穿过各个描点来代替原有的折线图。

欢迎关注我的博客,不定期更新中——

为什么要平滑拟合折线段

先来看下Echarts下折线图的渲染效果:
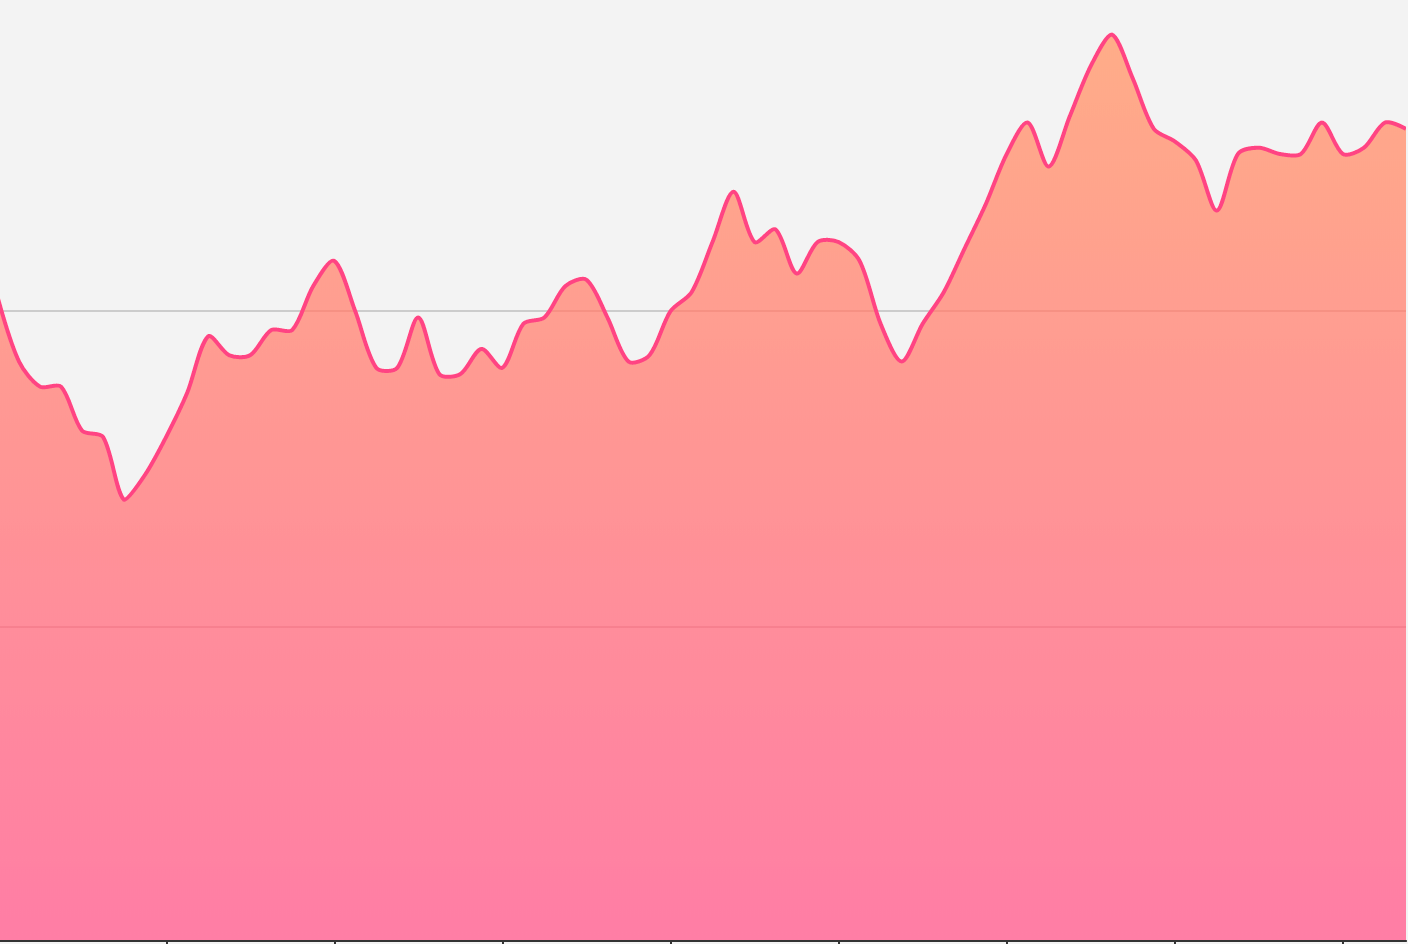
image
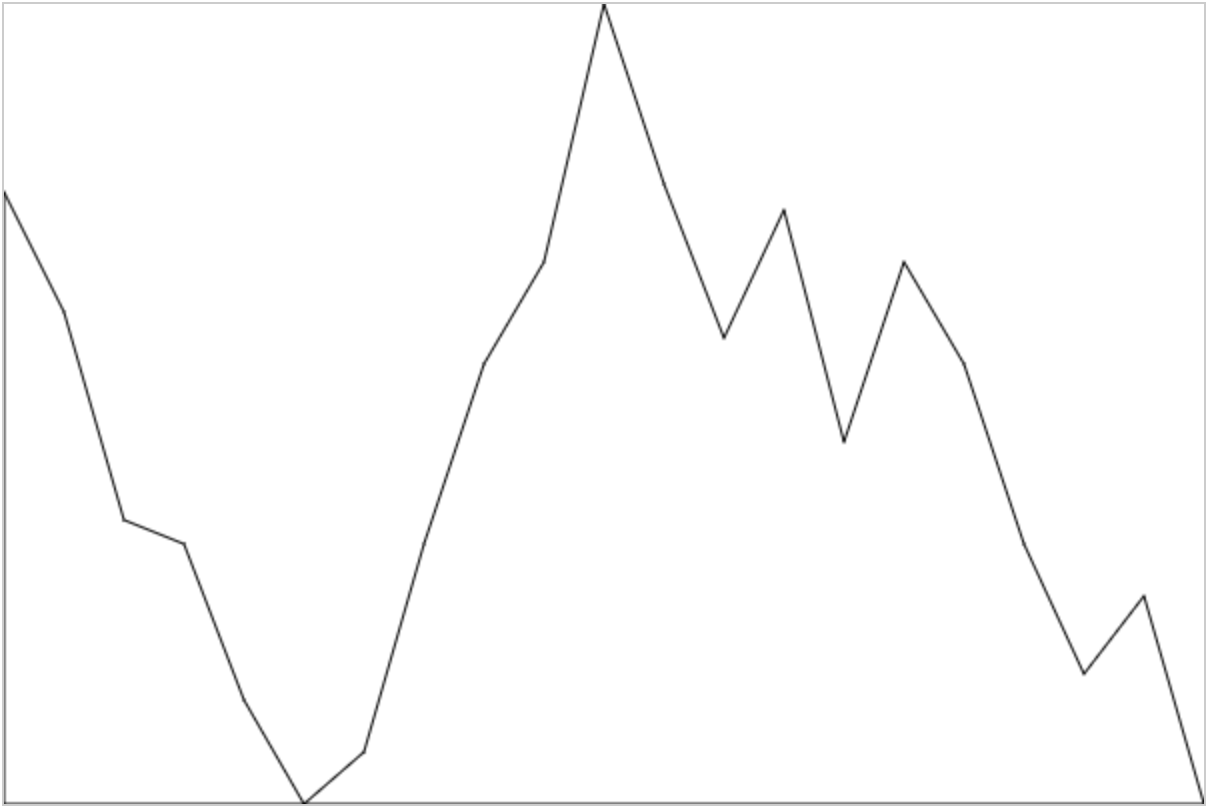
一开始我没注意到其实这个折线段是曲线穿过去的,只认为是单纯的描点绘图,所以起初我实现的“简(丑)易(陋)”版本是这样的:
image

不要关注样式,重点就是实现之后才发现看起来人家Echarts的实现描点非常的圆滑,也由此引发了之后的探讨。怎么有规律的画平滑曲线?

效果图

先来看下最终模仿的实现:
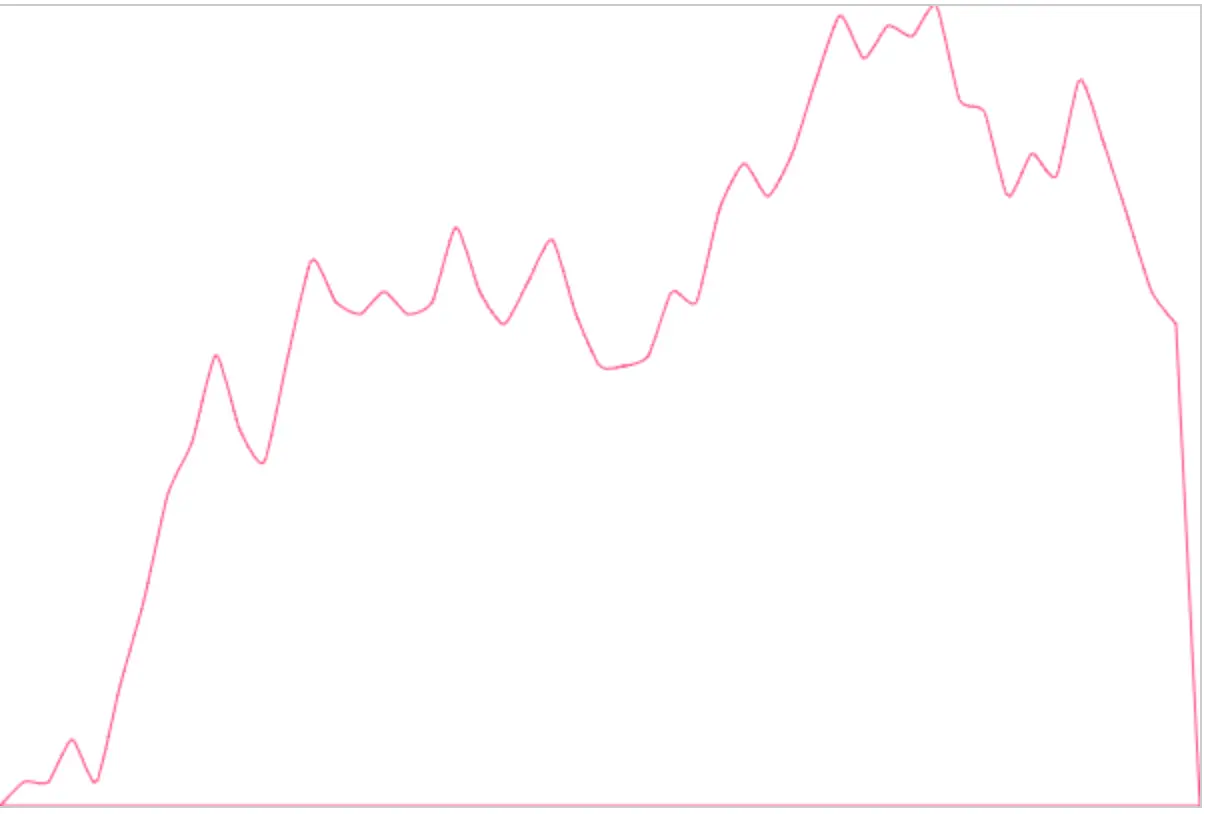
因为我也不知道Echarts内部怎么实现的(逃
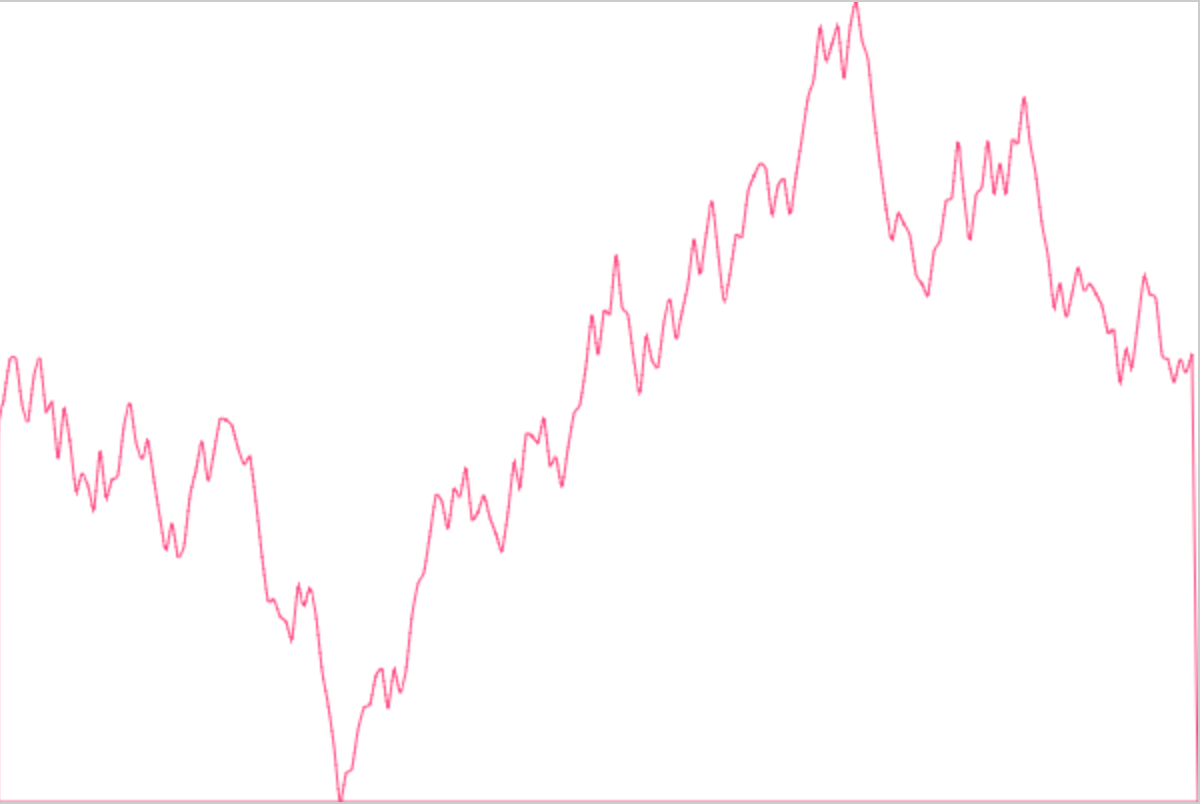
image.png
image
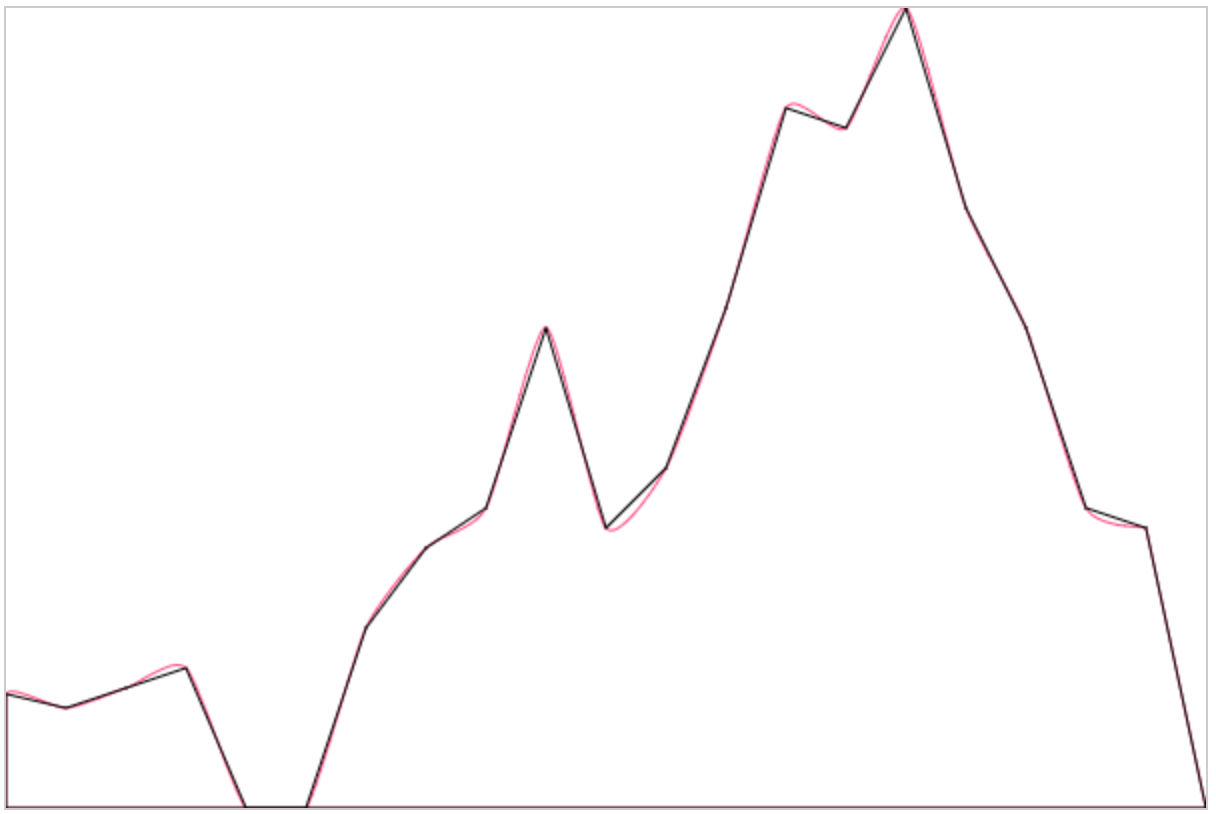
看起来已经非常圆润了,和我们最初的设想十分接近了。再看下曲线是否穿过了描点:
image
好的!结果很明显现在来重新看下我们的实现方式。

实现过程

  • 绘制折线图
  • 贝塞尔曲线平滑拟合

模拟数据

var data = [Math.random() * 300];
        for (var i = 1; i < 50; i++) { //按照echarts
            data.push(Math.round((Math.random() - 0.5) * 20 + data[i - 1]));
        }
        option = {
            canvas:{
                id: 'canvas'
            },
            series: {
                name: '模拟数据',
                itemStyle: {
                    color: 'rgb(255, 70, 131)'
                },
                areaStyle: {
                    color: 'rgb(255, 158, 68)'
                },
                data: data
            }
        };

绘制折线图

首先初始化一个构造函数来放置需要用到的数据:

 function LinearGradient(option) {
    this.canvas = document.getElementById(option.canvas.id)
    this.ctx = this.canvas.getContext('2d')
    this.width = this.canvas.width
    this.height = this.canvas.height
    this.tooltip = option.tooltip
    this.title = option.text
    this.series = option.series //存放模拟数据
}

绘制折线图:

LinearGradient.prototype.draw1 = function() { //折线参考线
    ... 
    //要考虑到canvas中的原点是左上角,
    //所以下面要做一些换算,
    //diff为x,y轴被数据最大值和最小值的取值范围所平分的等份。
    this.series.data.forEach(function(item, index) {
        var x = diffX * index,
            y = Math.floor(self.height - diffY * (item - dataMin))
        self.ctx.lineTo(x, y) //绘制各个数据点
    })
    ...
}

贝塞尔曲线平滑拟合

贝塞尔曲线的关键点在于控制点的选择,这个网站可以动态的展现控制点不同而绘制的不同的曲线。而对于控制点的计算。。作者还是选择了百度一下毕竟数学不好:),这篇文章对于将多个点使用贝塞尔曲线连接时各个控制点的计算。具体算法有兴趣的同学可以深入了解下,现在直接说下计算控制点的结论。

image

上面的公式涉及到四个坐标点,当前点,前一个点以及后两个点,而当坐标值为下图展示的时候绘制出来的曲线如下所示:

image

不过会有一个问题就是起始点和最后一个点不能用这个公式,不过那篇文章也给出了边界值的处理办法:

image
所以在将折线换成平滑曲线的时候,将边界值以及其他控制点计算好之后代入到贝塞尔函数中就完成了:

//核心实现
this.series.data.forEach(function(item, index) { //找到前一个点到下一个点中间的控制点
    var scale = 0.1 //分别对于ab控制点的一个正数,可以分别自行调整
    var last1X = diffX * (index - 1),
        last1Y = Math.floor(self.height - diffY * (self.series.data[index - 1] - dataMin)),
        //前一个点坐标
        last2X = diffX * (index - 2),
        last2Y = Math.floor(self.height - diffY * (self.series.data[index - 2] - dataMin)),
        //前两个点坐标
        nowX = diffX * (index),
        nowY = Math.floor(self.height - diffY * (self.series.data[index] - dataMin)),
        //当期点坐标
        nextX = diffX * (index + 1),
        nextY = Math.floor(self.height - diffY * (self.series.data[index + 1] - dataMin)),
        //下一个点坐标
        cAx = last1X + (nowX - last2X) * scale,
        cAy = last1Y + (nowY - last2Y) * scale,
        cBx = nowX - (nextX - last1X) * scale,
        cBy = nowY - (nextY - last1Y) * scale 
    if(index === 0) {
        self.ctx.lineTo(nowX, nowY)
        return
    } else if(index ===1) {
        cAx = last1X + (nowX - 0) * scale
        cAy = last1Y + (nowY - self.height) * scale 
    } else if(index === self.series.data.length - 1) {
        cBx = nowX - (nowX - last1X) * scale
        cBy = nowY - (nowY - last1Y) * scale
    } 
        self.ctx.bezierCurveTo(cAx, cAy, cBx, cBy, nowX, nowY);
        //绘制出上一个点到当前点的贝塞尔曲线
    })

由于我每次遍历的点都是当前点,但是文章中给出的公式是计算会知道下一个点的控制点算法,故在代码实现中我将所有点的计算挪前了一位。当index = 0时也就是初始点是不需要曲线绘制的,因为我们绘制的是从前一个点到当前点的曲线,没有到0的曲线需要绘制。从index = 1开始我们就可以正常开始绘制,从0到1的曲线,由于index = 1时是没有在他前面第二个点的故其属于边界值点,也就是需要特殊进行计算,以及最后一个点。其余均按照正常公式算出AB的xy坐标代入贝塞尔函数即可。

参考文章

最后

源代码见这里
惯例po作者的博客,不定时更新中——
有问题欢迎在issues下交流。

@GreendaMi
Copy link

  1. PathEffect mEffect = new CornerPathEffect(20);//平滑过渡的角度
    2.mPaint.setPathEffect(mEffect);
    3.canvas.drawPath(path, mPaint);
    直接用path实现,不用计算

@Aaaaaaaty
Copy link
Owner Author

@GreendaMi 大佬我百度了一下这个写法好像是安卓的0.0 我不太会233 我是用的html5的canvas..

@GreendaMi
Copy link

@Aaaaaaaty 打扰了,看起来像Android的kotlin

@Aaaaaaaty
Copy link
Owner Author

@GreendaMi 受教了受教了

@jellenm
Copy link

jellenm commented Feb 22, 2018

持续关注中....

@TigerCouple
Copy link

hi,请问,你的github的blog是用什么写的啊?markdown么?

@Aaaaaaaty
Copy link
Owner Author

@TigerCouple markdown

@wangfpp
Copy link

wangfpp commented Jun 5, 2020

diff是啥意思 没看明白

@Paxosgold
Copy link

  • Good morning team great job keep it up ****

Sign up for free to join this conversation on GitHub. Already have an account? Sign in to comment
Labels
Projects
None yet
Development

No branches or pull requests

6 participants