Skip to content
New issue

Have a question about this project? Sign up for a free GitHub account to open an issue and contact its maintainers and the community.

By clicking “Sign up for GitHub”, you agree to our terms of service and privacy statement. We’ll occasionally send you account related emails.

Already on GitHub? Sign in to your account

Chart Title Alignment #882

Closed
CalvinFernandez opened this issue Aug 25, 2016 · 22 comments
Closed

Chart Title Alignment #882

CalvinFernandez opened this issue Aug 25, 2016 · 22 comments
Assignees
Labels
feature something new

Comments

@CalvinFernandez
Copy link

Would it be possible to provide alignment API for chart title, "left", "center" "right" ?

@etpinard etpinard added the feature something new label Sep 1, 2016
@etpinard
Copy link
Contributor

etpinard commented Sep 1, 2016

Yeah. We should really add this.

The reason why nobody has done this yet is that the plot title at the moment is set via two root layout level attributes (layout.title and layout.titlefont) and adding more layout.title**** attribute would feel like polluting the root layout namespace.

Ideally, the main title should have its own layout object container, for example:

 layout.title = { 
  text: 'My title', 
  font: {
    size: 20,
    color: 'red'
  },
  x: 0,
  y: 1.2,
  xanchor: 'left',
  yanchor: 'bottom',
};

similar to layout.legend. So, to add layout.title: {} in a backward-compatible way would require some conversion step layout.title -> layout.title.text and layout.titlefont -> layout.title.font.

Moreover, axes titles (e.g. layout.xaxis.title) currently follow the same **title / **titlefont pattern. To preserve consistency between title attributes, we should also allow axes title to be input as layout.xaxis.title.text / layout.xaxis.title.font.

@mviertel
Copy link

Any progress on this?

@AlexVvx
Copy link

AlexVvx commented Dec 5, 2017

Hey, I created an pr on that issue, could you please take a look?
AlexVvx#3

@alexcjohnson
Copy link
Collaborator

Thanks for taking this on @AlexVvx! I'm torn about the right way to specify alignment. I'm going to continue the discussion here for a bit until we get the right attributes. The closest precedent we have is to use plot fraction, like legend & annotations. But it's hard to match the current behavior:

  • Vertically, we just split the top margin (after accounting for anything that may have auto-expanded that margin, such as a legend)
  • Horizontally, we center on the whole container, so if for example the right margin is much bigger due to a colorbar, the title will not be centered on the plot area.

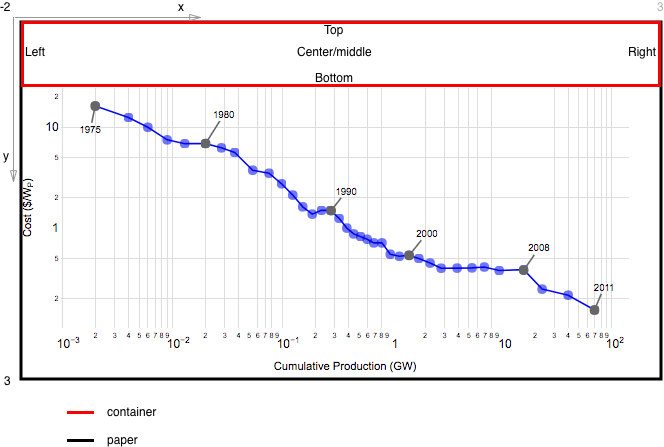
The most common alternative title placement is in the top left corner (also whole-container referenced), but occasionally you want the left edges of the title and plot area aligned.

Also keep in mind dynamic sizing, so pixel positioning isn't so great, unless perhaps we have a way to anchor to various plot features (left edge, left plot area edge, center, plot area center, right edge, right plot area edge...)

So the most general is perhaps:

  • xref and 'yref': 'container' (including margins) 'paper' (plot area only, not so great a name in this context but matches our usage elsewhere)
  • x and y: 0 is the left / top edge of the container or plot area, 1 is the right / bottom edge. Might need an 'auto' value for y to match the current behavior?
  • xanchor: 'left', 'center', 'right' - like for annotations, could also do an auto like we have there, so eg if you set x: 0 you get 'left' anchor by default? Auto is particularly nice if we allow the title to be dragged around, otherwise it's easy to get strange alignment that makes a mess when you resize the plot.
  • yanchor: 'top', 'middle', 'bottom' (auto?)
  • pad: like borderpad for annotations, move the text away from the anchor point by this many pixels (so you can position 5px away from the container edge, for example). Do we need xpad and ypad?

Thoughts? Does this miss anything important? Could it be simplified?

@etpinard
Copy link
Contributor

etpinard commented Dec 6, 2017

I agree with @alexcjohnson that we should make the attributes as close as possible to the current legend attributes.

I think both xanchor and yanchor should support an 'auto' values so that the common title.x: 0 automatically gets xanchor: 'left' just like legends.

I like the sound of xref: 'container' to match the current behavior. I think 'container' would also be useful for positioning legends at some point. Setting plot fractions beyond [0, 1] seems to confuse some users.

As for pad, perhaps we should ♻️ Ricky's pad_attributes currently used in sliders and updatemenus and start standardize it.

@alexcjohnson
Copy link
Collaborator

As for pad, perhaps we should ♻️ Ricky's pad_attributes currently used in sliders and updatemenus and start standardize it.

Good call. It feels awfully verbose to me, but it's going to come up at some point so better to standardize.

OK, I think we've got a good attribute set, @AlexVvx does this make sense? Care to take a stab at incorporating this into your PR?

@AlexVvx
Copy link

AlexVvx commented Dec 6, 2017

Sure, sounds good. Summarizing:

  • xanchor: "auto" | "left" | "center" | "right"
  • yanchor: "auto" | "top" | "middle" | "bottom"
  • pad: {t, r, b, l} like margin
  • x, y number between or equal to -2 and 3
  • xref, yref: not sure about this, since title is not related to any axis

Backward compatibility, skip new features if title is string (from https://community.plot.ly/t/change-position-of-title/1490/3)
Fix ie issue (#2076 (comment))

@alexcjohnson
Copy link
Collaborator

xref, yref: not sure about this, since title is not related to any axis

Right, not axes but whether x/y refer to the plot area (excluding margins) or the whole container (including margins). By default it should be the whole container, for backward compatibility and because that seems like the more common usage anyhow, for both centered and left-aligned titles.

Backward compatibility, skip new features if title is string

We should use cleanLayout to massage the old format into the new container.

The only issue I see with this is that applications using relayout/update to change the title (or its font) will break and need to update to the new structure. I suppose in principle we could do the same cleanLayout translation inside relayout - we haven't done that in the past but most of the stuff inside cleanLayout and cleanData are pre-open-source so it wouldn't matter, it's only relevant to plots saved on the plot.ly cloud. This part might be a little tricky to get right, so I'd be happy to do this (after you get the rest of the PR ready) if it's not obvious to you what I'm going for.

Also, from a private convo with @etpinard - it might be nice to have cleanLayout (and cleanData) call Lib.warn whenever they make changes, to alert developers about the format change. I'd be happy to take that one too.

@AlexVvx
Copy link

AlexVvx commented Dec 6, 2017

Ok, then:

  • xref: "container" | "plot"
  • yref: "container" | "plot"

I wonder about pad, if xanchor and yanchor is center/middle, should it respect paddings?
What is the difference between 'auto' and 'center', 'auto' and 'middle'?

@alexcjohnson
Copy link
Collaborator

xref: "container" | "plot"

I know it doesn't make the most sense considering only this context, but I think we should match the other xref instances and use 'container' and 'paper'. Perhaps in v2 we could change 'paper' to 'plot'.

@AlexVvx
Copy link

AlexVvx commented Dec 7, 2017

Finally:

  • xanchor: "auto" | "left" | "center" | "right"
  • yanchor: "auto" | "top" | "middle" | "bottom"
  • pad: {t, r, b, l} like margin
  • x, y number between or equal to -2 and 3
  • xref: "container" | "paper"
  • yref: "container" | "paper"
    chart

@alexcjohnson
Copy link
Collaborator

@AlexVvx apologies, I missed these pieces earlier:

I wonder about pad, if xanchor and yanchor is center/middle, should it respect paddings?

In this case since there's no border or fill (yet?) paddings are only going to be relevant on the same side as the anchor, so you're right, it's moot for center and middle.

What is the difference between 'auto' and 'center', 'auto' and 'middle'?

From @etpinard above:

I think both xanchor and yanchor should support an 'auto' values so that the common title.x: 0 automatically gets xanchor: 'left' just like legends.

ie the anchor shifts to match the nearest third of the plot.

@AlexVvx
Copy link

AlexVvx commented Dec 8, 2017

Thank you, one more question regarding picture below. Red rectangle is container, black is 'paper'. I wonder if title will be in the center of paper, on the top of traces. Is that expected?
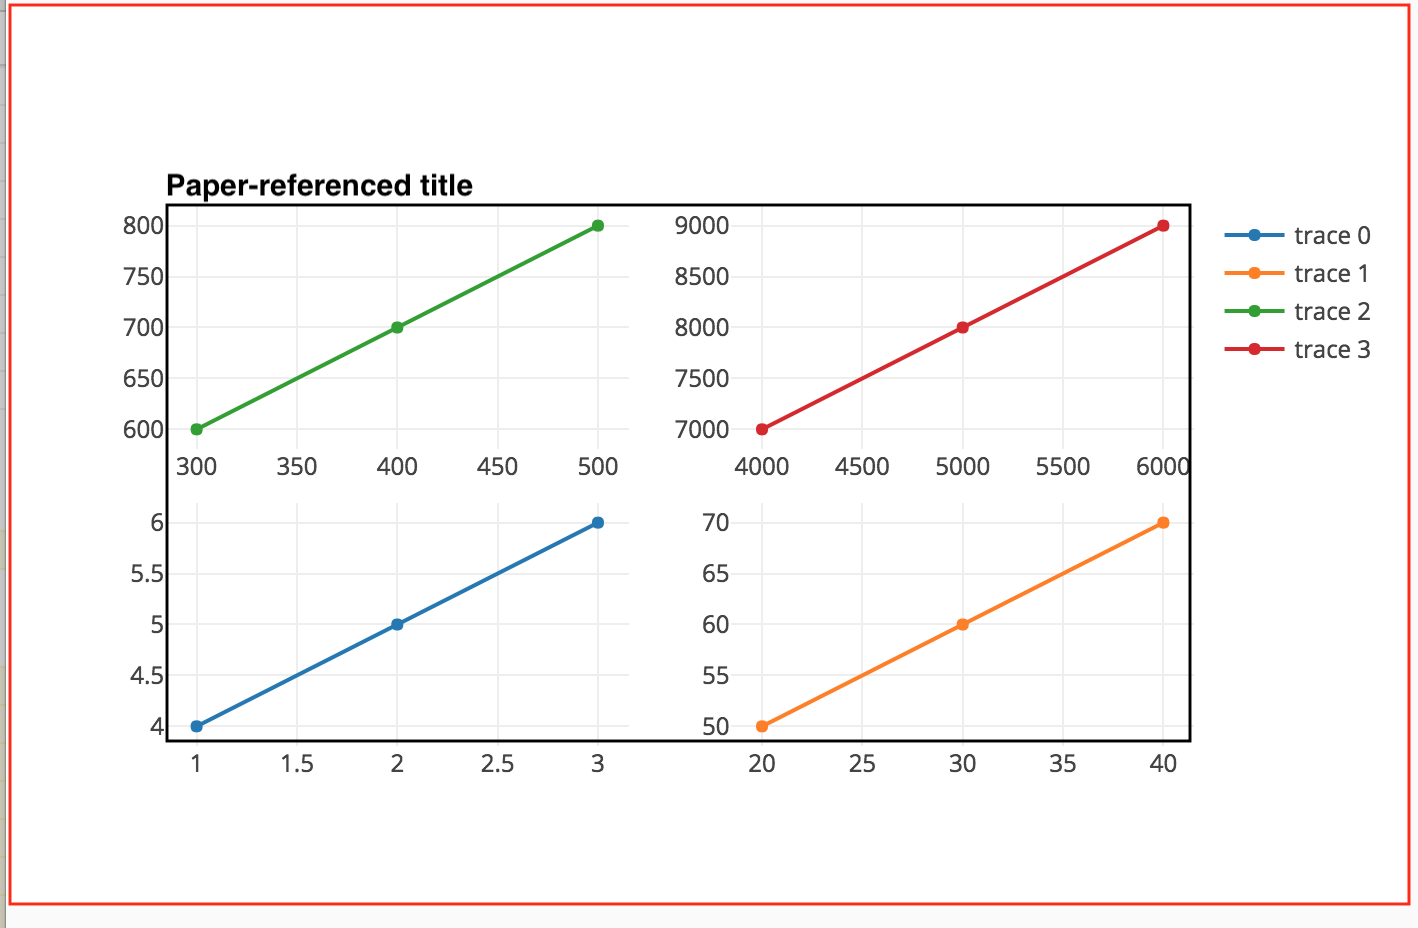
@alexcjohnson
Copy link
Collaborator

See below: Red is 'container', it's the entire area of the plot <div> including margins. Black is 'paper', it's the coordinate system used to lay out subplots, the legend, and paper-referenced components (shapes, annotations, images), and is basically red minus margins. Be careful because occasionally the margins are increased beyond what was originally specified - use fullLayout._size, it already knows about this.

You're right, it would be weird to put the title in the middle, though maybe there would be uses for it - like if you make a donut chart and want the title in the hole? The main use for 'paper' in title positioning would be sitting on the subplots like the "Paper-referenced title" below. This would look like:

title: {
  text: 'Paper-referenced title',
  xanchor: 'left', // or 'auto', which matches 'left' in this case
  yanchor: 'bottom',
  x: 0,
  y: 1,
  xref: 'paper',
  yref: 'paper'
}

screen shot 2017-12-08 at 10 05 36 am

@AlexVvx
Copy link

AlexVvx commented Dec 29, 2017

I wonder if that is right behavior:

  • when x:0, y:1, yref: 'paper', then auto yanchor is bottom

33771976-182b799a-dc01-11e7-9d00-75fb32063754

- when x:0, y:1, yref: 'container', then auto yanchor is top

plotly container yref

ypad should move title to the top or to the bottom?

@etpinard
Copy link
Contributor

cc @rmoestl

@rmoestl rmoestl self-assigned this Oct 24, 2018
@rmoestl
Copy link
Contributor

rmoestl commented Nov 14, 2018

Moreover, axes titles (e.g. layout.xaxis.title) currently follow the same **title / **titlefont pattern. To preserve consistency between title attributes, we should also allow axes title to be input as layout.xaxis.title.text / layout.xaxis.title.font.

Okay to apply this change to polar.radialaxis.title as well?

@etpinard
Copy link
Contributor

Okay to apply this change to polar.radialaxis.title as well?

Yep, go for it. Ternary axes should use the new structure too.

@etpinard
Copy link
Contributor

... and gl3d axes as well.

@rmoestl
Copy link
Contributor

rmoestl commented Nov 14, 2018

Alright.

BTW colorbar is re-using the titles component as well. I decided to not transition colorbar title attrs to the new structure. Partly because colorbar lives within data, while the other titles live in layout.

@etpinard
Copy link
Contributor

BTW colorbar is re-using the titles component as well. I decided to not transition colorbar title attrs to the new structure. Partly because colorbar lives within data, while the other titles live in layout.

👍

@etpinard
Copy link
Contributor

Done in #3276 !

Sign up for free to join this conversation on GitHub. Already have an account? Sign in to comment
Labels
feature something new
Projects
None yet
Development

No branches or pull requests

6 participants