This document contains the outline and code snippets for my 2012 JSConf.eu talk: Faster than C? Parsing binary data in JavaScript
Hi everybody, my name is Felix Geisendörfer and today I'd like to talk about "Faster than C? Parsing Node.js Streams!".
Before I get started, I would like to appologize for the "Title Bait". This talk is analyzing the performance of JavaScript vs C-Bindings for MySQL in node.js, but not JavaScript vs. C itself.
So, I have this module I wrote that lets you talk to MySQL databases in node.js. I started it because in early 2010 there were no MySQL modules for node.js. Well, that's not quite true. There was one module by Yuichiro MASUI. But unfortunately he never finished it.
However, there was something interesting about it. It was written in JavaScript. I mean just JavaScript, no C/C++. In fact it was even crazier, because when that module was started, node.js did not have Buffers. So this guys was doing all the MySQL parsing using JavaScript Strings. WTF!
Btw. here is a piece of node.js trivia - did you know that Buffer was originally named Blob in node.js? Thinking about it, Blob would have been a much better name for it, because Buffer can have so many other meanings. Unfortunately the name "Blob" died at a very young age. Merely 3 minutes and 15 seconds after landing the Blob commit, Ryan decided to rename the object to Buffer. Oh well ... RIP Blob.
Anyway, back to mysql. So masui's module was really inspiring for me. Before I saw it, I though the only way to get mysql working was to bind to libmysql. However, the problem is that libmysql is a blocking library and the mechanics of integrating a blocking library with node were not very clear back then.
So in a rather compulsive move, I was like "FUCK THIS" and started to write a new MySQL client from scratch. I did not continue with masui's code base because it was based on strings. Anyway, over a time span of about 3 months, this code base turned into a working library called node-mysql and people started using it.
But ... you know how it is in this universe. No good deed goes unpunished. Newton already discovered this in 1687 and is now known as the third law of motion:
When a first body exerts a force F1 on a second body, the second body simultaneously exerts a force F2 = −F1 on the first body. This means that F1 and F2 are equal in magnitude and opposite in direction.
Now, of course Github did not exist back then, but I'm pretty sure that if it did, Newton would have become a programmer, and he would have discovered something like this.
When a first person pushes a library L1 into a remote repository, a second person simultaneously starts working on a second library L2 which will be equally awesome, but in a different way.
-- Third law of Github
And this is what happened, Oleg Efimov released a new library called mysql-libmysqlclient.
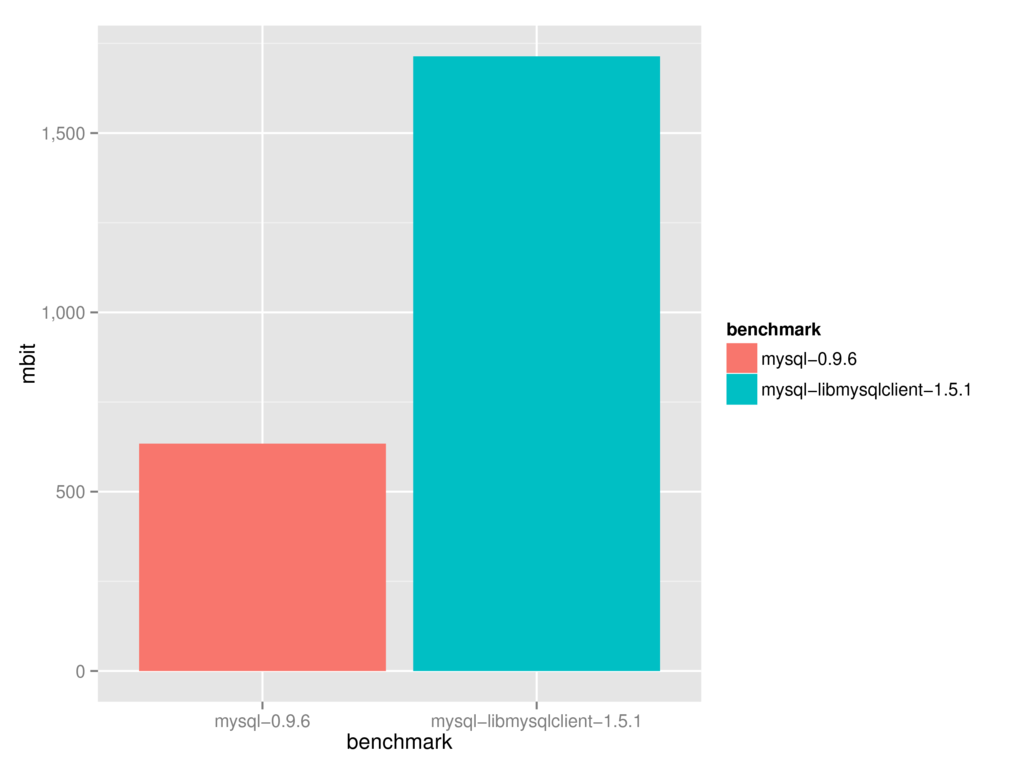
His library had a few disadvantages compared to mine, but it was awesome by being much faster:
This, benchmarks shows the performance of parsing 100.000 rows / ~180 MB of network data from the MySQL server.
Initially I thought, fuck, of course. libmysql is written in C, that's why Oleg's library is much faster. Maybe I can optimize mine and get another 10-20% performance boost, but there is no way I can get a 300% increase.
But wait ... wasn't V8 supposed to turn my code into assembly? And was it not supposed to be insanely fast? And wasn't node going to solve all of my problems anyway? Had I been lied to?
Well, of course I had been lied to. Node and V8 don't make shit go fast. They are just tools. Very capable tools, sure, but you still need to do the work.
So after I overcame my initial resignation, I set out to make my parser faster. The current result of that is node-mysql 2.x, which can easily compete against libmysql.
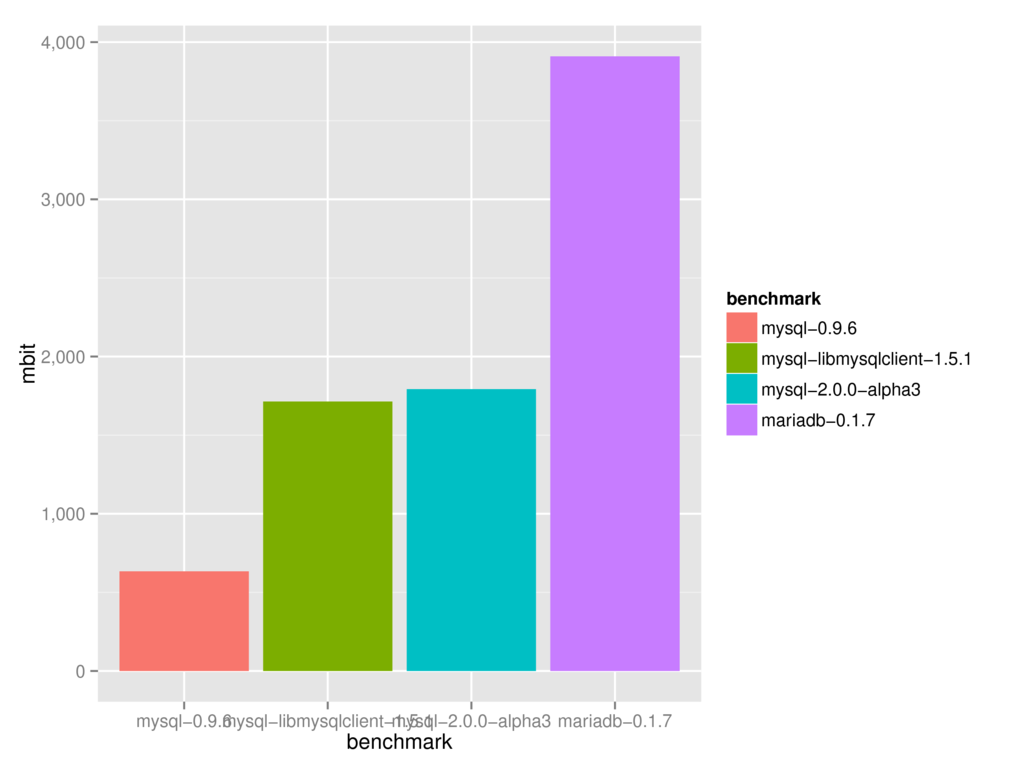
But again, it didn't take long for the third law of Github to kick in again, and a few months ago a new library called mariasql was released by Brian White.
And yet again, it was an amazing performance improvement. As you can see in this graph, mariasql is kicking the shit out of my library:
So fuck - maybe it's time to finally give up and accept that I cannot compete with a well engineered C binding. C must be faster after all.
Well - fuck this! This is unacceptable. Fuck this "C is the only choice if you want the best performance" type of thinking. I want JavaScript to win this. Not because I like JavaScript, oh it can be terrible. I want JavaScript to win this because I want to be able to use a higher level language without worrying about performance.
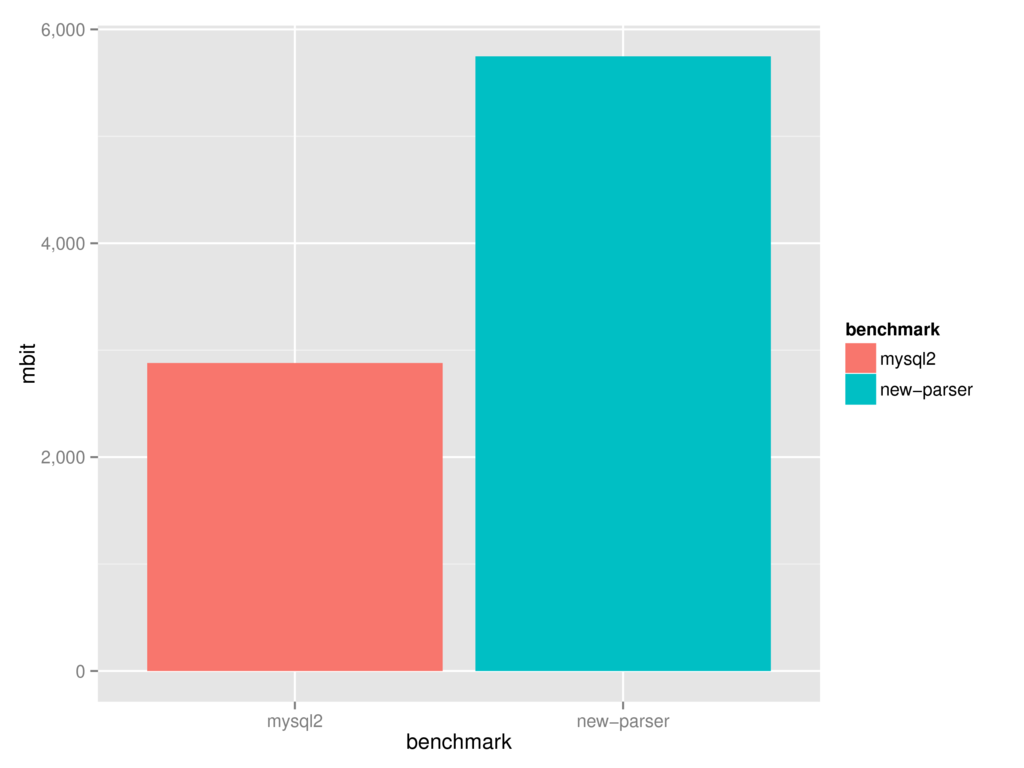
So ... I am hacking on a new parser again. And from the looks of it, it will allow me to be as fast as the mariaqsql library:
Of course, the 3rd law of GitHub would predict that this won't last very long,
However, I don't think that will be the case this time. I think we are approaching the "Endgame". The "Engame" is the point where the main bottleneck will be the cost of turning network data into JavaScript objects. This cost is equal for JavaScript libraries, as well as for C++ addons making V8 calls.
Also, when a single client can process 5000 MBit/s utilizing a single CPU, your MySQL server has long exploded. So finally we should be able to consider database drivers a "solved problem" as far as performance is concerned.
Anyway, who cares. Let's stop talking about my unfinished new parser and mysql. Let's talk about writing fast JavaScript programs, and what works, and what does not.
The natural tool people reach for when fixing performance problems is the
profiler. In node this is done by starting your program with node --prof
which creates a v8.log file which you can then analyze with
node/deps/v8/tools/mac-tick-processor. This only works if you have d8, the
v8 command line interpreter, in your $PATH, but whatever, you will get an
analysis of what functions are consuming a high percentage of time (ticks) in
your program.
This works really well if your performance is lost in a small function performing an inefficient algorithm with many iterations. The profiler will tell you about this function, you fix the algorithm, and you win.
But, life is never this easy. Your code may not be very profilable. This was the case with my mysql 0.9.6 library. My parser was basically one big function with a huge switch statement. I thought this was a good idea because this is how Ryan's http parser for node looks like and being a user of node, I have a strong track record for joining cargo cults. Anyway, the big switch statement meant that the profiler output was useless for me, "Parser#parse" was all it told me about : (.
So this is when I discovered that profiling is a very limited tool. It works in some situations, but in my case, and many other cases, it provided very little value.
Another thing that does not work is taking performance advise from strangers. And by strangers I mean anybody who is not deeply familiar with your exact problem. Sure, the VM engineers you will meet at this conference are amazing, and they will be able to give you many good ideas and inspiration. However, applying this knowledge blindly is never going to result in good performance.
So stop listening to specific performance tips, and instead listen to this.
While working on my module, I have only found one technique that continuously produced good results for me. Benchmark driven development.
So what is benchmark driven development, and how can you use it to write very fast JavaScript programs. Well, first of all you have to accept that speeding up your current code base will be very very hard. If performance is a really important design goal for you, you have to integrate it into your development work flow from the beginning. This is very similar to test driven development, where you write tests from the beginning to achieve a high level of correctness in your software.
So how does benchmark driven development work? Well, you start by creating
a function you want to benchmark. Let's call it benchmark:
function benchmark() {
  // intentionally empty
}
Now you write a benchmark for it:
while (true) {
  var start = Date.now();
  benchmark();
  var duration = Date.now() - start;
  console.log(duration);
}
Congratulations, you have just written the fastest function in the world. Unfortunately it does not do anything. So the next step is to implement the minimal amount of code that is useful to you. For the MySQL protocol, this would mean parsing the packet headers. While you do this, keep running the benchmark and tweak your code trying to make it stay fast while adding features.
Doing this will allow you to gain an intuitive understanding of the performance impacts your coding decisions really have. You will learn that most performance tips you have heard of are complete bullshit in your context, and some others produce amazing results.
Here are a few things I learned from applying this technique, but they are just examples. Please do not attempt similar optimizations unless you are solving the same problem as me:
- try...catch is ok
- big switch statements = bad
- function calls are really cheap
- buffering / concatenating buffers is ok
- eval is awesome (when using its twin
new Function(),eval()itself sucks)
Here is the eval example:
function parseRow(columns, parser) {
  var row = {};
  for (var i = 0; i < columns.length; i++) {
    row[columns[i].name] = parser.readColumnValue();
  }
}
Turns out this can be made much faster by doing this:
var code = 'return {\n';

columns.forEach(function(column) {
  code += '"' + column.name + '":' + 'parser.readColumnValue(),\n';
});

code += '};\n';

var parseRow = new Function('columns', 'parser', code);
This optimization turned out to be a huge success, and it's what allowed my new parser to gain another 20% of performance after being very fast already.
Of course this could turn into a security problem, but that can be easily fixed
by escaping the column.name properly.
The next thing you should do is analyze your data. And for the love of god, please don't use a benchmarking library that mixes benchmarking and analysis into one step. This is like a putting SQL queries into your templates - don't do it.
No, a good benchmark produces raw data, for example tab separated values work great. Each line should contain one data point of your benchmark, along with any metrics you get can from your virtual machine or operating system. Pipe this data into a file for 1-2 minutes.
Now that you have the raw data, start to analyze it. The R language is a great tool for this. Try to automate it as much as possible. My flow is like this:
- Use the unix
teeprogram to watch your output and record to a file at the same time. - Use the R Language and ggplot2 to analyze / plot your data as pdfs (Check out RStudio and this tutorial to get started quickly)
- Annotate your PDFs with Skitch or similar
- Use imagemagick to convert your PDFs into PNGs or similar for the web
- Use Makefiles to automate your benchmark -> analysis pipeline
So why should you analyze / graph your data? Can't I just use the median? Well, no. Otherwise you end up with bullshit. In fact, all of the benchmark graphs I have shown you so far are complete bullshit. Remember the benchmark showing the performance of my new parser?
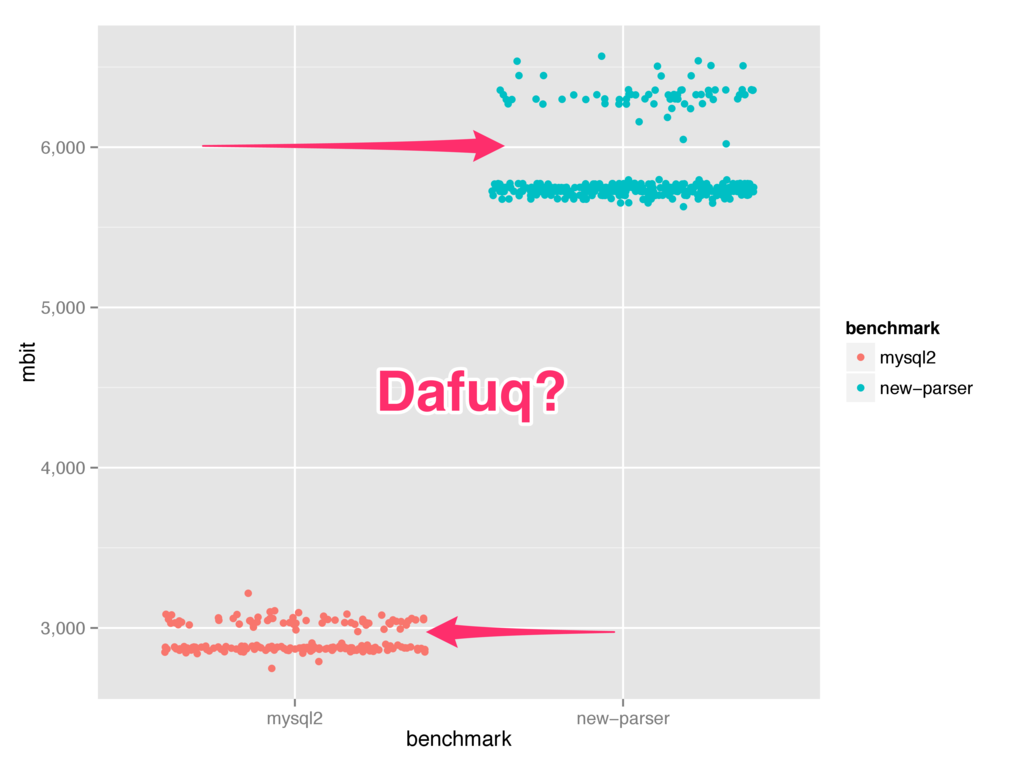
Well, let's look at it another way. Here is a jitter plot:
Ok, looks like we have a problem, why are there two clusters of data points in each benchmark? Well, let's look at this data another way:
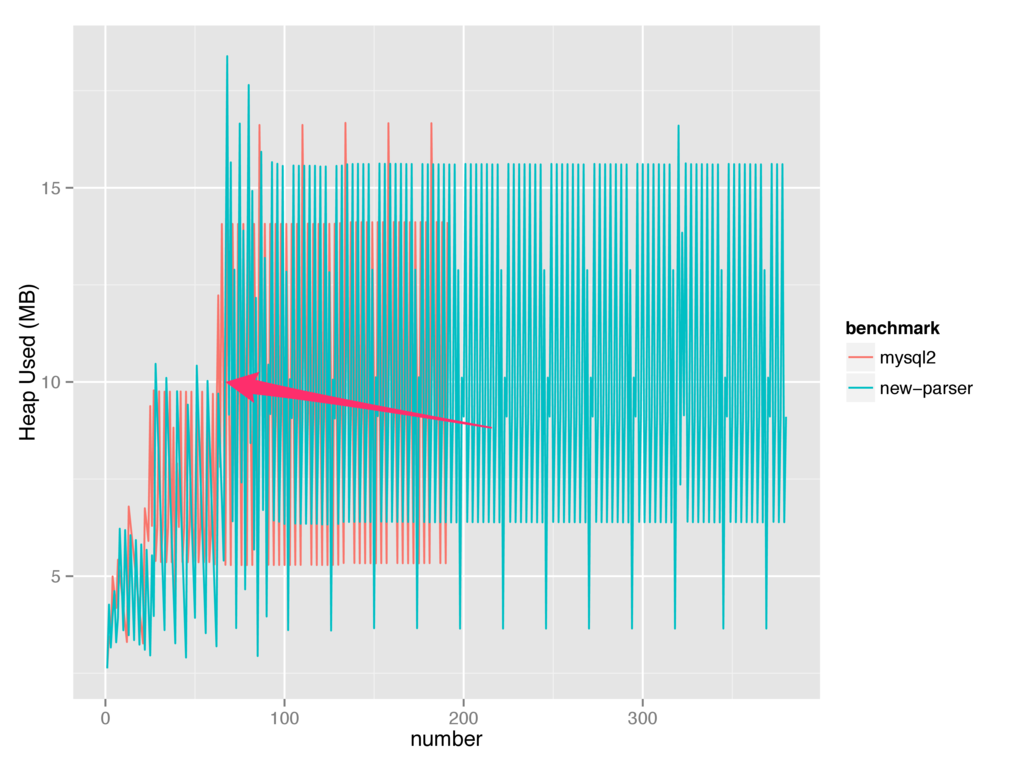
So, it seems like performance starts out great, but then something happens and things go to hell. Well, I'm not sure what it is yet, but I have a strong suspect. Let's have a look at this graph showing the heap used:
As you can see, it seems during the same moment our performance goes to shit, v8 decides to give more memory to our programs before performing garbage collection.
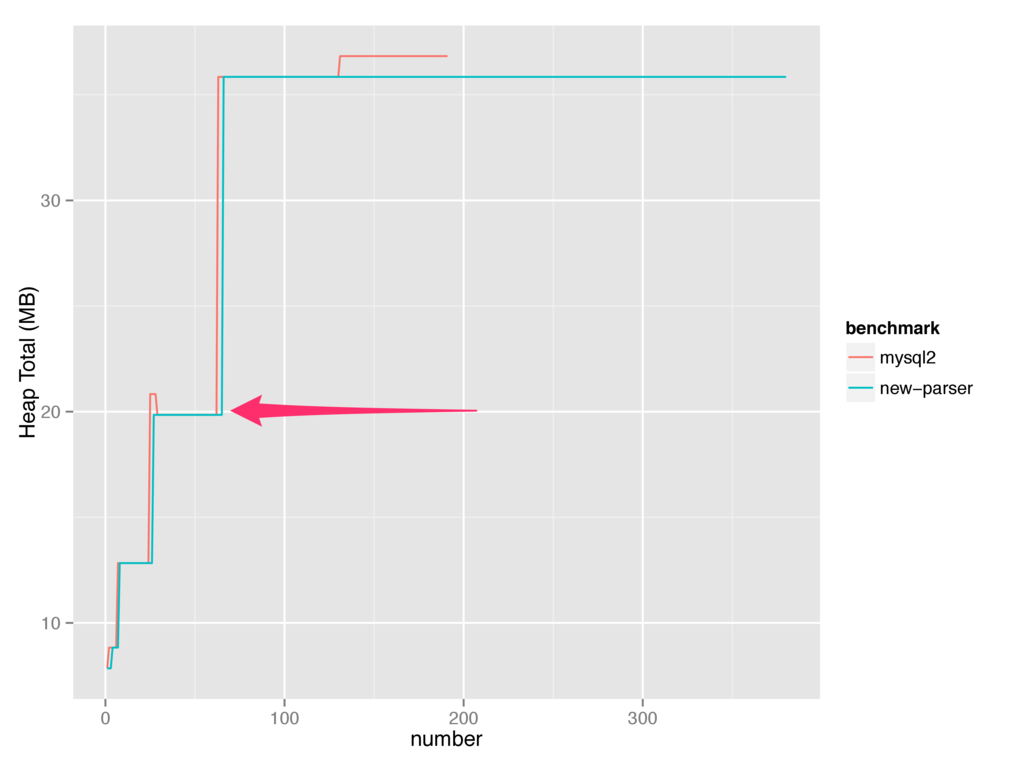
This can also be seen when looking at the heap total:
So, chances are good that v8 is making the wrong call by growing the heap total here. There is also a good chance I'm still doing something stupid.
Either way, I have identified a significant problem in my quest for performance and I can now try to fix it.
And now you know almost everything there is to know about writing high performance JavaScript:
- Write a benchmark
- Write/change a little code
- Collect data
- Find problems
- Goto 2
That's all I got. Thank you.


