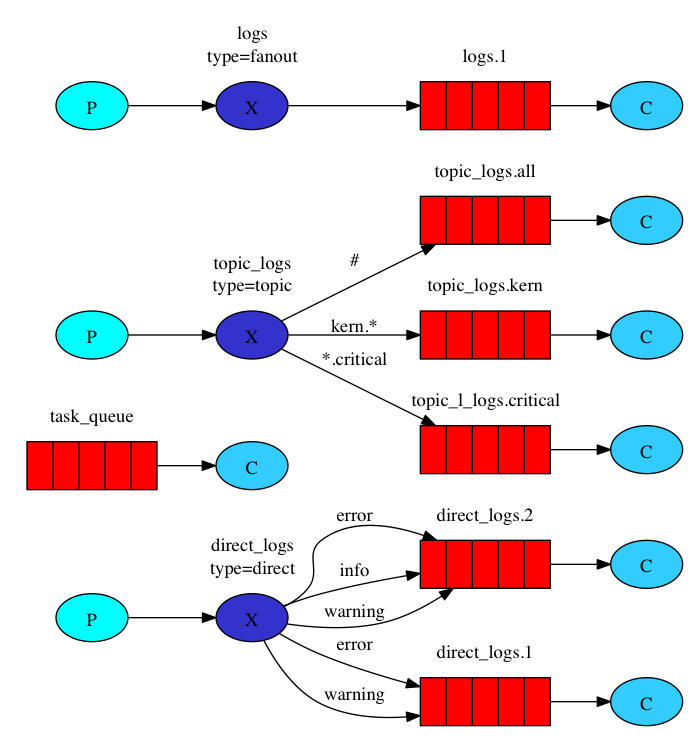
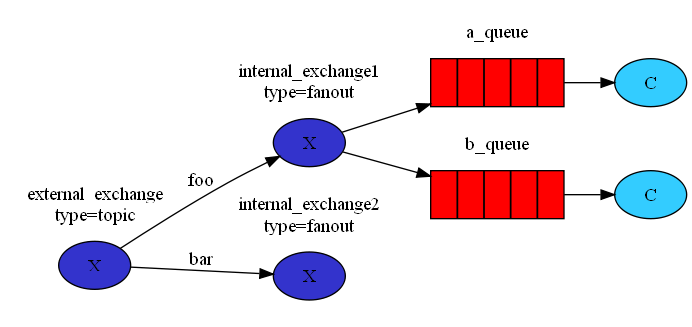
Script to display RabbitMQ topology using graphviz, heavily inspired by the RabbitMQ Getting Started tutorial.
To generate the samples (currently only one):
$ make samples
To run:
$ python rabbitmq_graphviz.py -d [DEFINITIONS_FILE] -o [DOT_FILE]
Use the -p and -c flags to render a producer and consumer respectively. This assumes one publisher per exchange and one consumer per queue (because the real topology is not known to the broker), but has been included on the basis that it gives a basic outline that can be manually updated if needed.
Per default, the script renders the default vhost '/'. Use the -v flag to explicitely use another vhost.
For help:
$ python rabbitmq_graphviz.py -h
Limitations:
- there is currently no way to render all vhosts in one image
Sample output for the default vhost '/':
Sample output for the custom vhost '/somevhost':

