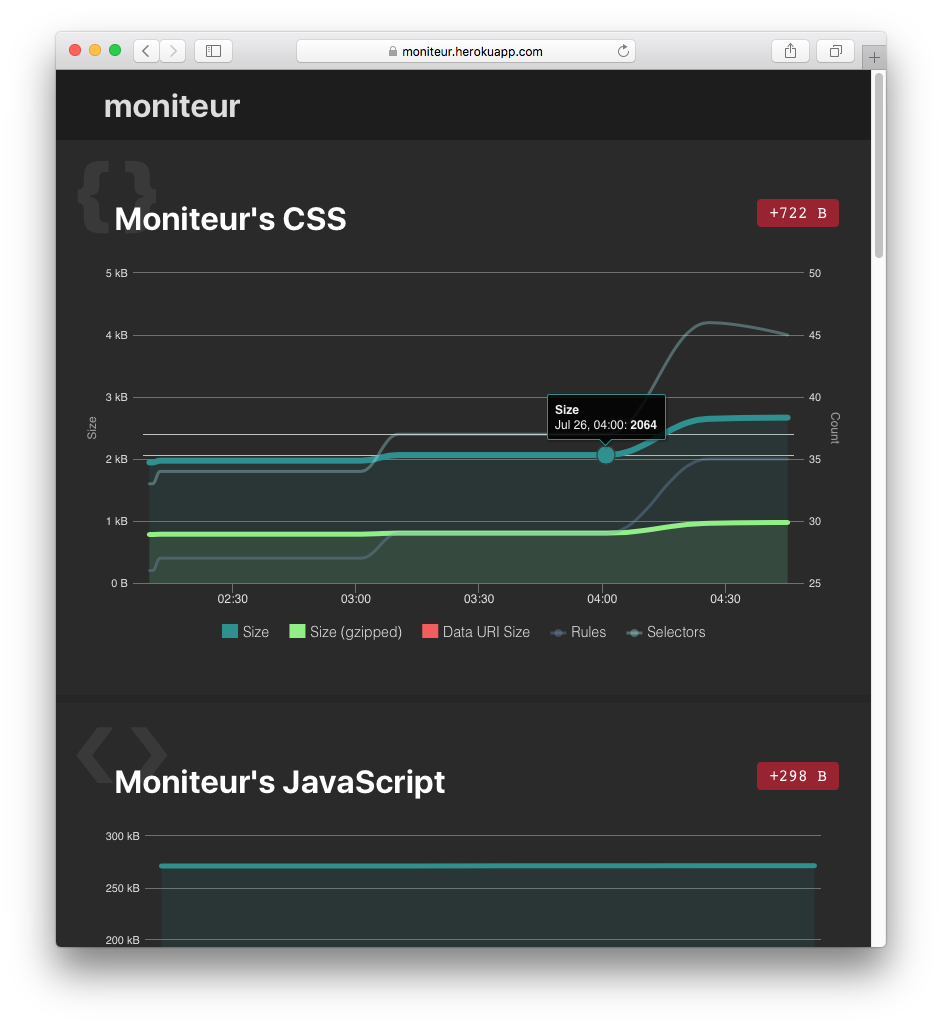
For people who care about keeping an eye on their CSS and JavaScript file sizes.
Moniteur is also available as a command line interface:
npm install -g moniteurUsage: moniteur [options] [command]
Commands:
record record a snapshot of all asset metrics
serve start the server to show metrics in the browser
assets display the list of assets loaded by moniteur
help display this helpful message
Options:
-h, --help output usage information
-V, --version output the version numberConfiguration: edit the .moniteurrc.yml file in the current directory.
For now, two types of storage are supported: Redis and local filesystem.
A Redis URL can be passed through an environment variable, instead of having it stored in the configuration file:
DB__REDIS_URL=redis://rediscloud:[email protected]:13714
Run your application like this:
DB__REDIS_URL=redis://url moniteur [options]
Note that REDIS_URL and REDISCLOUD_URL are also valid environment variables.
Clone the repository and run:
npm run devTakes a snapshot of asset metrics and stores them in the .moniteur/
directory.
moniteur record/assets.json
Since forever:
/metrics/stylesheets/adf6e9c154cb57a818f7fb407085bff6
Between two dates:
/metrics/stylesheets/adf6e9c154cb57a818f7fb407085bff6/1015711104475..1415711104475
MIT
Merci to https://github.com/t32k/stylestats, which has been a great source of inspiration.
And thanks to @oncletom for helping building the early versions of moniteur.
- Make moniteur a working node module
- Run as some sort of daemon that monitors asset metrics every X seconds
- Monitor JavaScript files
- Unit / Integration tests
- Option to filter graphs by time range (last 7 days, last 30 days, last year)
- Slack Bot
- Providing a page's URL, scrape all assets out of it and analyse them
- Parse all assets in a particular directory
- Asset size budget limits
- Email alert when budget is almost reached or exceeded
- Weekly email recaps

