Polar 2.0 #2200
Polar 2.0 #2200
Conversation
... and reuse Scatter.selectPoints straight up 🎉
... instead of hacky subplot ref punched during ScatterPolar.plot
- selections and hover are working
- not much else
- that update `polar.radialaxis.position`
src/plots/cartesian/axes.js
Outdated
| // If same angle over a full circle, the last tick vals is a duplicate. | ||
| // | ||
| // TODO must do something similar for angular date axes. | ||
| if(ax._id === 'angular' && Math.abs(rng[1] - rng[0]) === 360) { |
There was a problem hiding this comment.
I had to hack a few things deep into axes.js to get the angular axes looking the way I wanted. I hope @alexcjohnson won't mind.
There was a problem hiding this comment.
What if you use something else as the period of a linear angular axis? Also do we need to do something more flexible to handle nearly duplicate values so we don't get overlaps?
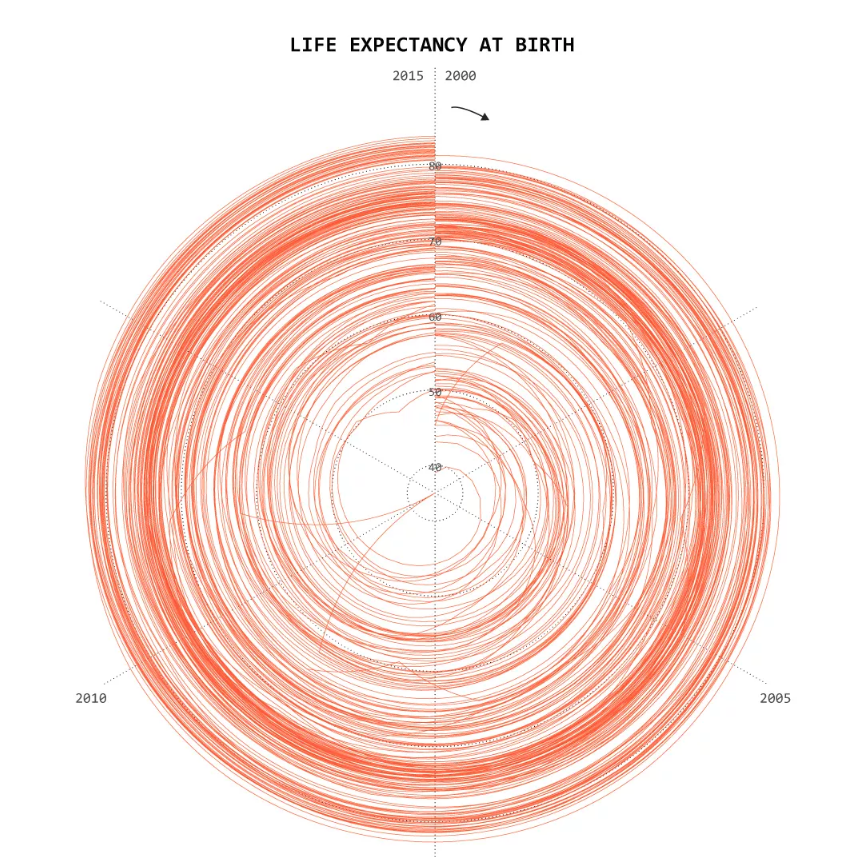
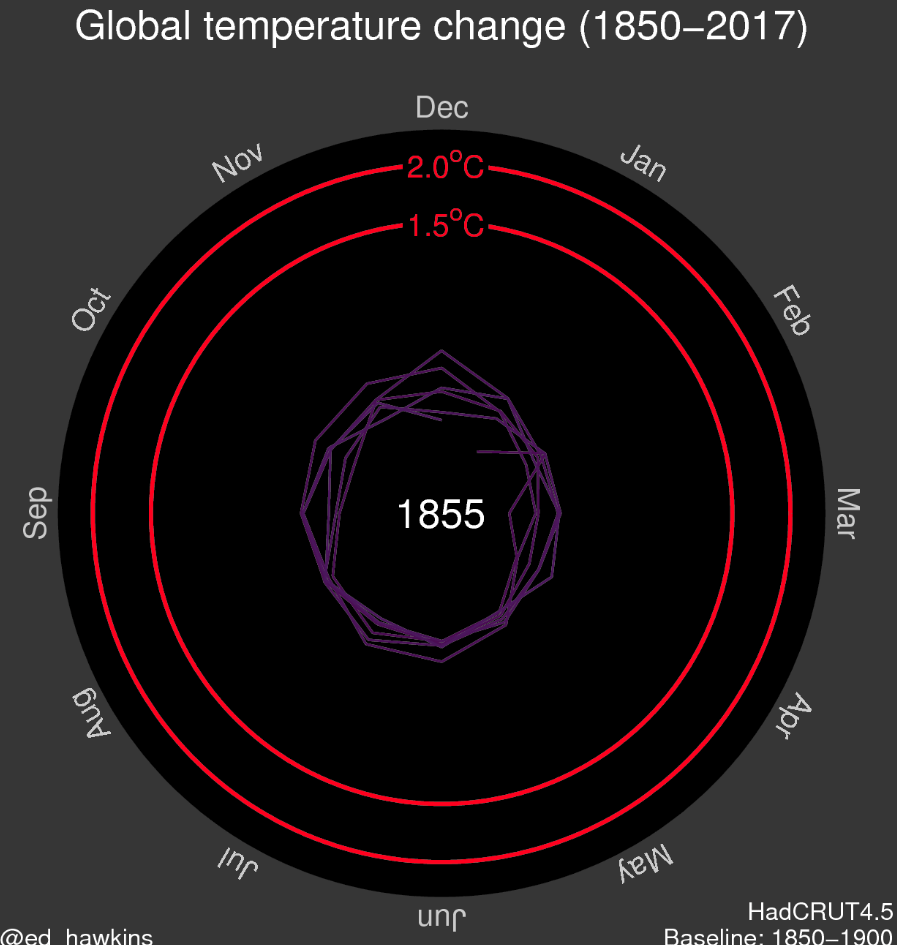
| // http://www.seasonaladjustment.com/2012/09/05/clock-plot-visualising-seasonality-using-r-and-ggplot2-part-3/ | ||
| // https://i.pinimg.com/736x/49/b9/72/49b972ccb3206a1a6d6f870dac543280.jpg | ||
| // https://www.climate-lab-book.ac.uk/spirals/ | ||
| }, |
There was a problem hiding this comment.
Some screenshot of date angular axes:


There was a problem hiding this comment.
Great feature !! Can you please include the code (layout config attributes) for the above example screenshots?
src/plots/polar/layout_attributes.js
Outdated
| // as it always starts at 0? But, looks like off-zero cutout polar chart are | ||
| // a thing: | ||
| // -> mpl allow radial ranges to start off 0 | ||
| // -> same for matlab: https://www.mathworks.com/help/matlab/ref/rlim.html |

| @@ -1905,7 +1905,7 @@ axes.doTicks = function(gd, axid, skipTitle) { | |||
| var axLetter = axid.charAt(0), | |||
| counterLetter = axes.counterLetter(axid), | |||
| vals = axes.calcTicks(ax), | |||
| datafn = function(d) { return [d.text, d.x, ax.mirror].join('_'); }, | |||
| datafn = function(d) { return [d.text, d.x, ax.mirror, d.font, d.fontSize, d.fontColor].join('_'); }, | |||
There was a problem hiding this comment.
Cartesian axes use a special ticks update pathway that.
This here gets Axes.doTicks to update properly. I'm pretty sure some axis style updates are currently broken for ternary subplots. I'll lock those down in tests soon.
|
🎉 🏆 |
|
Re: zooming interaction: I think we may need two different modes, eventually if not right away, because there are two very different ways polar plots get used. One is where you're drawing a real 2D space (where zero is a unique point and shapes have meaning) just in polar coordinates. That's where you would want zoombox-type interactions that I was thinking of. I notice though that none of your examples are of this type (except maybe the cardioid). Your examples all have independent R and Theta variables, just mapped onto a polar space mostly to show periodicity. Incidentally, this points to another way the behavior may want to depend on this distinction: what do you do with negative R? If you're mapping a real space, then it should show up as a positive R in the opposite direction, but if you're not it should disappear at the origin. So how should zooming work in the independent-variable case? I still need to look at some more example plots with the question "how would I want to zoom this to explore THIS data set", but as a first cut, I feel like the most useful for people would be to independently move each of the axis ends - so min and max radius (dragging them like you drag an axis end in cartesian? @etpinard points out that this is ambiguous with interacting with data near the origin though... not sure how to handle that.), and for angle I guess initial angle (rotating the whole plot) and period (so points at the initial angle would stay put, points at initial angle + period would move with the cursor, points at initial angle + twice the period would move twice as fast as the cursor... per private discussion with @etpinard this interaction should NOT happen when the period is physically significant, like 360 degrees or 2Pi - perhaps we can have an attribute to enable/disable it, with a smart default set depending on whether an explicit period is provided or not)? I also liked the way our old polar plots had the radial axis on top of the data, with an outline around the text in the background color. Perhaps it could be configurable whether this axis is above or below the data? |
Absolutely. I'll add a |
In antenna design, where Here's an example of a more dense polar line plot, where you could see how it might be helpful to zoom into the region near -40db |


| nums: 'r: 4.022892\nθ: 2.239991', | ||
| name: 'Trial 3' | ||
| }, { | ||
| desc: 'on work on log radial axis', |
There was a problem hiding this comment.
on work on log radial axis
src/plots/polar/polar.js
Outdated
|
|
||
| // make a small cut on full sectors so that the | ||
| // inner region isn't filled | ||
| if(isFullCircle(sector)) s1 -= 1e-3; |
There was a problem hiding this comment.
FWIW pies solved this by making two arcs at each radius so the annulus really is complete.
Probably not going to cause any issues, it's just missing a fraction of a pixel, but I worry a little about numerical stability - it has to determine the center of the circle based on the very small vector from p00 to p01 and I'm not sure how much precision SVG uses.
|
Two problems I just encountered with interaction effects, both while looking at the polar_direction mock:
|
src/plots/polar/polar.js
Outdated
| _this.clipPaths.circle.select('path').attr('transform', | ||
| strTranslate(cxx, cyy) + strRotate(da) | ||
| ); | ||
| // 'un-rotate' marker and text points |
There was a problem hiding this comment.
Oh man, that is such a satisfying effect 🍹
|
@etpinard Fantastic work! Aside from the three quick comments above (at least I hope the interaction bugs are quick 😅 ) the only thing I'd like to see before merging is an issue collecting open items, so we can point people to that when questions arise, and use it to prioritize future additions. |
- fixup angular drag xy -> angle calculations
- decrease min drag value for radial drag box,
  to catch smaller dx/dy
  that can determine rotateMove vs rerangeMove
- better annulus path
- typo in scatterpolar test
- by default, dragElement clamps small x,y displacement to 0
  independently
- for radial drag box, using d(x,y) to determine 'small' displacements
  to clamp prove more advantageous.
| * clampFn (optional, function(dx, dy) return [dx2, dy2]) | ||
| * Provide custom clamping function for small displacements. | ||
| * By default, clamping is done using `minDrag` to x and y displacements | ||
| * independently. |
There was a problem hiding this comment.
Nicely done. And it works great to solve the radial/angular drag bug! 🎯
|
A hard-fought 💃 - excellent work. |
|
Merging. For future development ideas and updates, please subscribe to #2255 |
|
Oh and please note that (r,t) legacy polar charts are now deprecated! Please switch over to |
should close everything listed under the on-par polar milestone 🎉
I'm making a PR at this stage to:
scatterpolarglwork.Working features so for:
scatterpolaris on-par withscattertenarye.g. lines, markers, text, some fills options and line shapes as well as point selections are supported.scatterpolaraccepts input angles in both degrees and radians using a polar-onlythetaunitattributepolarsubplots have fully configurable radial and angular axes styling.polarsubplots. (seepolar_direction)polarsubplots can be carve into sectors (seepolar_sector)polarsubplots can display angular tick labels in degrees or in fractions of pi.polarsubplots accepts category as angles (seepolar_categories)Quick demo:
Biggest open item: zoombox interactions
What should zoom interactions look like? At first, me and @alexcjohnson thought that a viewbox-based zoom system would suffice. In details, we thought about exposing a set of scalar attributes e.g.
polar.x,polar.yandpolar.zoomthat determine the location and zoom-level of the polar subplots with respect to theirpolar.domainbounding-box. But there's a problem with such system: for some sets ofx/y/zoomvalues, viewers won't see the subplot radial and/or angular axes - making data point only discernible via hover.While adding functionality for non-full
polar.sectorvalues, I thought that perhaps we could make zoombox interactions correspond to a combination of polarsectorand radial axis range relayout updates. That is, zooming in on a point would correspond to carving a sector around it and narrowing theradialaxis.range(note that radial axis ranges that don't start at 0 are common in other libraries e.g. matlab).@nicolaskruchten pointed out that generalising
polar.sectorto some 4-pt polar bounding box attribute could allow for even better zooming interactions (we should probably draw that on a whiteboard and take a screenshot to make it easier to grasp).So I ask: is
x/y/zoomzooming more intuitive than some fancy sector/radial range algo?cc'ing @jackparmer @cpsievert @monfera @bpostlethwaite who might also be interested.